Last week, I reported an increase in my X Blue metrics. Almost every single metric went up from the week before. This week, it's a mixed bag, but what a bag!
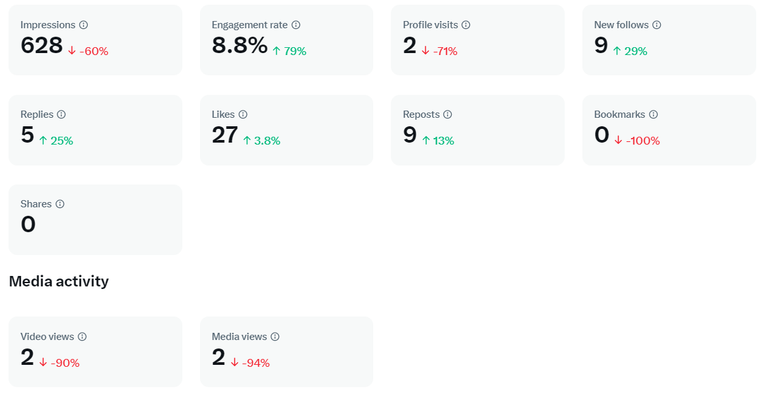
As you can see, impressions are down 60 percent from last week, but the engagement rate is up by 79 percent. A whopping 8.8 percent overall.
Other metrics that are up this week include:
- New follows by 29 percent
- Replies by 25 percent
- Likes by 3.8 percent
- Reposts by 13 percent
The sliding metrics include:
- Profile visits by 71 percent
- Bookmarks by 100 percent
- Video views by 90 percent
- Media views by 94 percent
Overall, I'm fairly pleased.
Impressions and Engagements
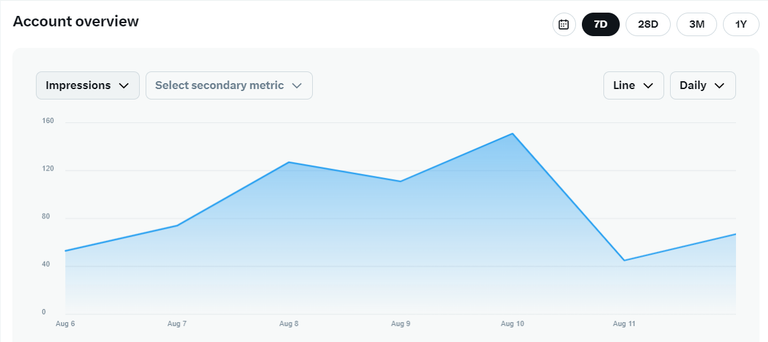
In terms of impressions, while that metric fell by 60 percent, the graph for the week looks fairly positive. You can see a gradual climb through the week up through Saturday, August 10 when impressions peaked at 151. They fell sharply the next day though and appear to be on the climb going into today.
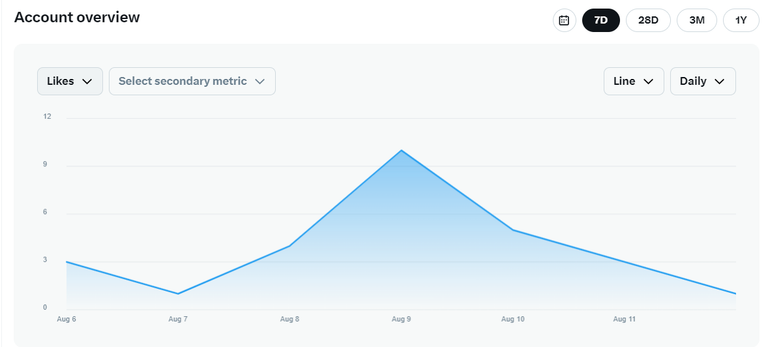
Likes have a nice mountain peak culminating in a beautiful summit on Friday, August 9 with 10 likes.
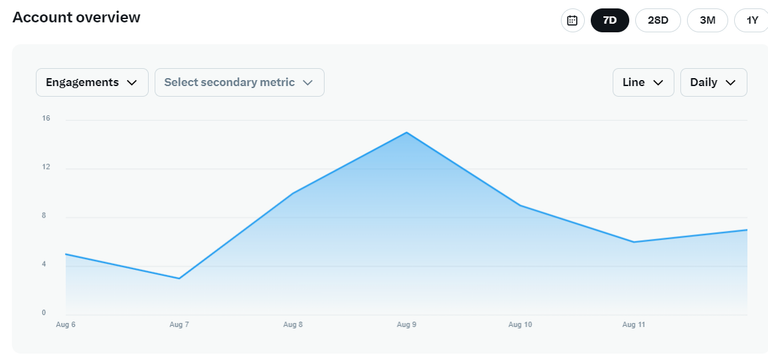
Engagements also peaked on the 9th with 15 but have a little less grade to the slope leading to the summit.
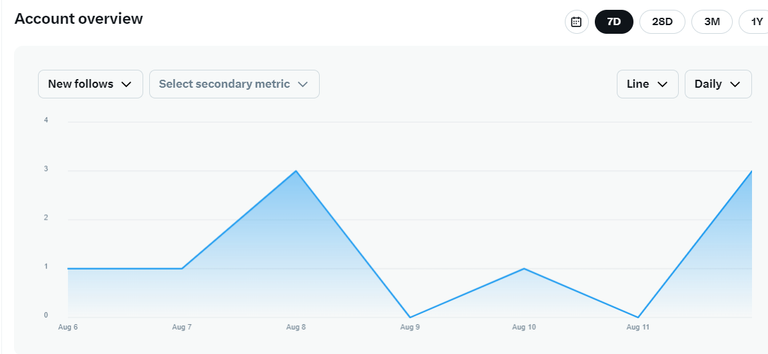
New follows have a jagged snaggle-tooth look with a high of 3 on both Thursday, August 8 and Monday, August 3. I finished the week with 458 followers.
Replies show a slow and steady climb throughout the week culminating in its high on August 12.

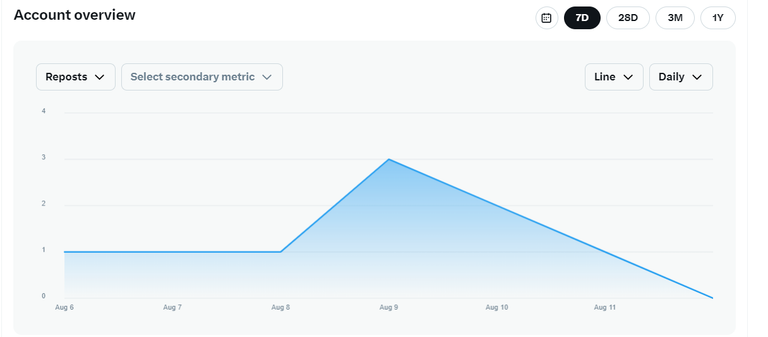
Finally, reposts peaked on August 9, the third metric to show its summit on that day.
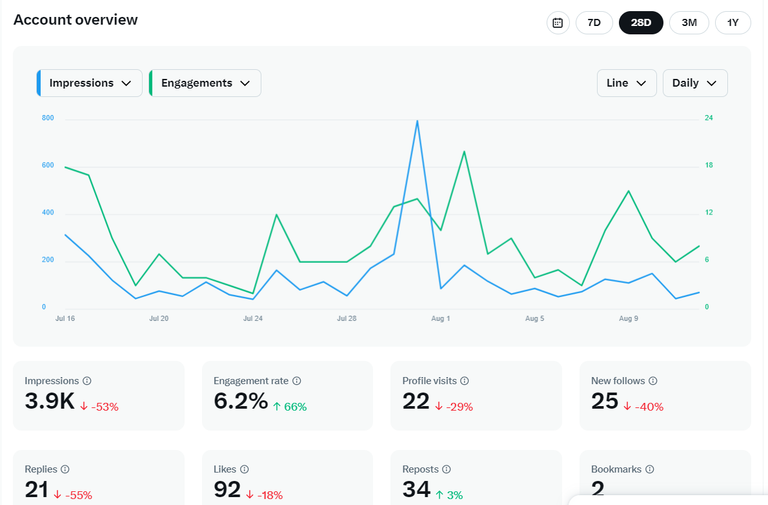
Just for smiles and giggles, I thought I'd look at a comparison between impressions and engagements over 28 days. The picture is quite nice. The only day when the relative ups and downs of both metrics cross paths is on Wednesday, July 31 when impressions hit 796 and engagements registered 14. Beautiful mountain peak of impressions that day. Engagements have several of their own mountain peaks during the period.
Well, that's my report this week. What do you think?
Posted Using InLeo Alpha